A statistical analysis of my review lessons
I have previously written about my classes’ review lessons, in which a group of students presents each unit’s material in a 20-minute presentation the day before the unit test. These lessons have at times seemed quite effective (usually when the presentation indicated a good understanding of the material, prompting good questions and learning from the class) though at other times a bit useless (usually when the group floundered on their presentation and didn’t offer a valuable summary to the class). I have also received mixed feedback on the lessons from students and other teachers, so I started wondering how I could evaluate their effectiveness statistically, with some level of objectivity. This could either confirm their current utility or challenge my preconceptions, requiring some rethinking of how I am teaching – a win either way.
Since the goal of the review presentations is to increase student learning, and the most direct measurement of student learning concerning these presentations is the following unit tests, the obvious question to try to answer statistically is “do the review lessons improve student scores on unit tests?” That is, however, very difficult to answer – first since I have no control group of classes which didn’t take review lessons, and second because differences between individual students and even groups of students often overwhelm any measurable effect review lessons might have. I may try to control for those variables and examine this question later, but for now I put a “very difficult” pin in it and tried to think of other questions that would lead to insights.
The related question I decided I could answer is more subtle: “does the review lesson have an effect on the test score of the presenters?” My hypothesis was yes, that the act of preparing to present a review would increase a student’s knowledge on that unit relative to if they did not present a review. And although such an effect wouldn’t provide direct evidence that the review presentations improve the learning of the audience, it would at least be helpful to discover the effect on the presenters.
In order to measure this effect, I had to determine a measure of how the student should have done on a given unit test: a projected test score. I used a very simple statistic to project test scores: the student average on all tests plus a modifier for the test difficulty, which was the test average minus the overall class average. This way, the student’s score for a test is being predicted both on their overall performance and the class’s overall performance on that test.
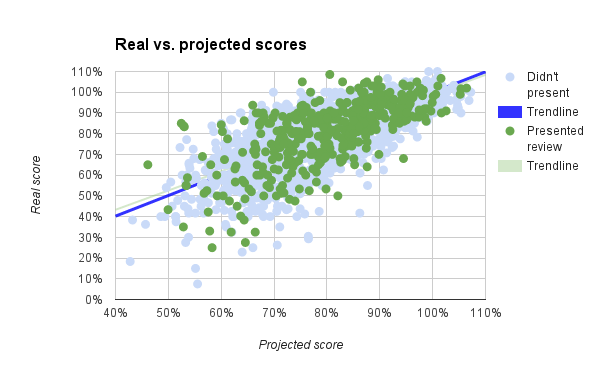 I calculated projected test scores for all student tests, not just ones where the students presented review lessons, and the scatter plot of projected scores vs. real scores is shown to the right. The projected and real scores have a correlation coefficient of 0.74, which means that my projected scores are doing fairly well in actually projecting a student’s score, without just being the score itself. As students are human and have ups and downs, their performance can vary widely from test to test which the projected scores don’t convey.
I also separated the data into tests where students did not present (blue dots) and where they did (green dots). If my hypothesis was correct, the green dots should be more above the trendline (real score = projected score) than below. From the chart alone, there is not compelling evidence that this is the case. In fact, the mean difference of review lesson test scores versus projected score is 0.5%, meaning that over all my students in two years, there was a less than 1% positive effect of review lessons on the test scores of the presenters.
Since this analysis includes the entire population of students I have taught at ASFM, you can look at this as a descriptive statistic and finish there. A half-percent bump isn’t much, and it’s certainly lower than I had hoped to find. However, to determine whether this effect was statistically significant I considered the data instead to come from a sample of students, where the entire population was now all students that I have taught or hypothetically will teach. This way I can use inferential statistical techniques (specifically hypothesis testing) to determine what the likelihood is that this small increase could be a product of random chance.
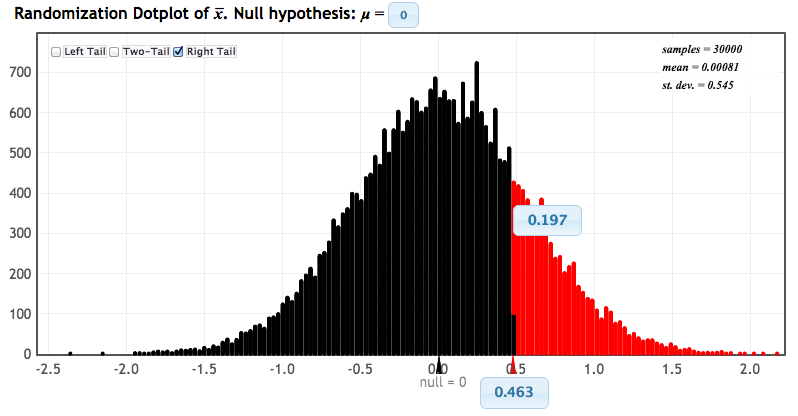 Since I’m teaching Statistics next year I’ll have more posts up throughout the next year which explain inferential statistics in more detail; for this one I’ll get to the point. When considering my review lesson scores as a group to be sampled from the entire population of non-review lesson scores, they had a mean of 0.463% and a sample size of 415. The mean of the whole population was 0.000% and had a certain distribution, so we can repeatedly sample random data groups of 415 data points from this distribution and measure their means, resulting in a distribution of sample means. We then apply a p-test to discover what proportion of sample means are at least 0.463. This test, accomplished by StatKey, showed that 19.7% of means sampled were above 0.463. If we consider the chance of means also being as extreme in the other direction (i.e. use a two-tailed test), we can conclude that there is a ~40% chance of a sample group of the same size having a mean as extreme as found in the review lesson scores, which is to say that there is a 40% chance that, assuming the review lessons had no impact at all, the observed mean could have been generated. Under no significance level (usually 5% or 1%) is this statistically significant to reject that assumption, so we conclude that there is no significant data to confirm our hypothesis – i.e. we can’t say statistically that the review lessons are having any effect at all.
Obviously this was a blow to my confidence; however, it’s better to have insight on something that may not be working than to blithely assume it is and continue. I decided to examine whether the review lessons are having an impact on certain students by trying to correlate the review lesson “score effect” (i.e. real test score minus projected score) with other data points.
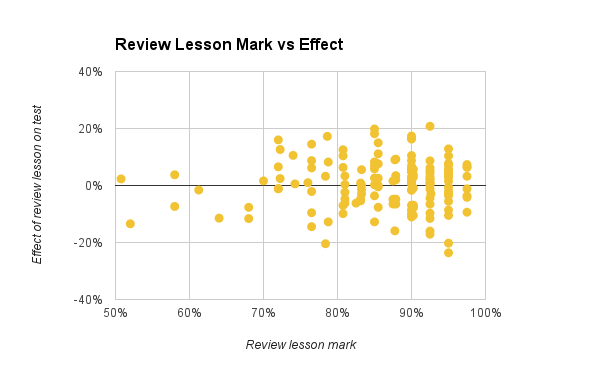 My first new hypothesis was that students with better scores on the review lessons themselves (the scores measuring their effort and success on that presentation) would have a better effect on the test scores. This would be a great result and could be used as a student motivator – imagine being able to conclusively tell students that those who did better on their review lessons did better on their tests. Unfortunately no such relationship seemed to exist; indeed, the correlation between review lesson scores and the test effect was just 0.013, not demonstrating any consistent correlation.
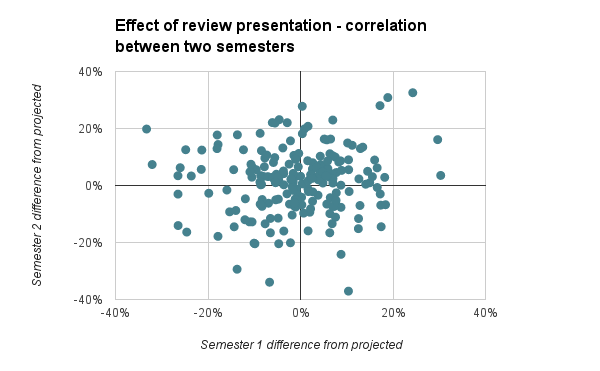 My second hypothesis was more general, that some students’ test scores actually did benefit from the review lesson in some way. Since students each presented two review lessons (one per semester), I tried to find a correlation between the review lesson’s effect on their test score in the first and second semesters, with the idea that students who found the review lesson useful in Semester 1 would also in Semester 2 and vice versa. This also turned out to be false, with a correlation coefficient of 0.090, again not demonstrating any significant relationship between the statistics.
As you can imagine at this point, it is very tempting to call the game and give up on review lessons as useless. Indeed, they may be! However, I want to explore a few possible interpretations of this data first:
- The projection measure is useless. There’s a saying I’m learning in statistics: garbage data in, garbage out. The “projected exam score” estimator is the basis for all these analyses, and I’m not confident that it is a good measure. However, it does correlate fairly well with the exam data and is an unbiased estimator over the whole population (i.e. the mean difference between the projected score and the real score is 0), so it satisfies a few basic considerations. I am going to think and discuss with colleagues about ways to improve this estimator.
- I’ve done something else wrong. I’m not an expert in statistics so it’s possible I have misinterpreted something here.
- The review lessons have an effect on all students, not just the presenters. It is possible and hopeful that the process of doing review lessons is helping students learn and helping improve test scores, just not especially helping the presenters of these lessons. I will have to do more investigation and find more data sources to evaluate this. As well, this may need to be evaluated holistically as well as statistically, using qualitative feedback to give a complete picture rather than blindly trusting data.
- There is a minor positive effect. The data above didn’t rule out the possibility that the 0.5% bump was real, it just didn’t confirm statistically that it had to be related to the review lessons. However, perhaps with a refined review presentation process this effect will grow to a level of statistical significance.
- Review lessons don’t actually help students on tests. Of course, we also have to consider that the lack of evidence may in fact be trying to reveal an ineffective teaching tool.
What am thinking about after all of this? Many things. First, that I am going to have a conversation with my colleagues and especially teaching partners about using review lessons. Second, that they are ineffective at helping the students presenting them improve their test marks, but that doesn’t rule out other effects. This means that they probably should be tweaked to improve their effectiveness (and then tested again!) or replaced with a more effective tool. Third, I need to improve my data collection and statistical understanding in order to better analyze the effectiveness of my teaching techniques.
Finally, I know that statistics don’t tell the whole picture. In addition to trying to help students review unit material for tests, review lessons are important in their own way, to measure students skills at communicating mathematical understanding and knowledge outside a testing situation. Whatever changes I make as a result of this statistical analysis, I will keep in mind the importance of students discussing and speaking about math.